04.20.2019: One Lesson of Math - Circular Functions, 9/10: Graphing the Tangent Function
- Steven C. Mills

- Apr 20, 2019
- 3 min read

Today's soundtrack is Relient K: ᚎ Score and Seven Years Ago, a pop-punk album that is probably the most introspective material that I've heard Relient K release yet.

We've learned how to graph the sine and cosine functions. Now, we're learning how to graph the tangent function.
The tan graph is made up of multiple vertical asymptotes, between each of which exists a line that starts in negative infinity near the left asymptote, has a point of inflection that is located on the graph's central horizontal axis, balanced perfectly between the values of the vertical asymptotes in which it is encased, and continues upwards to positive infinity.

Properties of the Tangent Function
Period: In the function y = tan θ, the graph starts at (0,0), goes up to its asymptote, jumps down to negative infinity, and continutes on up to (π, 0).
Thus, its period is π radians.
Domain: The default graph runs from -2π to 2π. Of course, the asymptotes are not included. See the section below titled "Asymptotes" to learn how to calculate these!
So the domain is -2π ≤ θ ≤ 2π, with the restriction x ≠ (-3π/2), (-π/2), (π/2), and (3π/2).
Range: We know that the graph goes up to negative infinity and jumps down to negative infinity.
This means that its range is y∈ℝ.
x-intercepts: Inside the domain -2π ≤ θ ≤ 2π, we have four x-intercepts.
The x-intercepts are -π, 0, π, and 2π.
y-intercept: We see a single y-intercept at the origin of the graph.
The y-intercept is 0.
Asymptotes: These values were included as exceptions to our domain. They are evenly spaced between our x-intercepts. We can determine the location of any asymptote with the equation x = π/2 + nπ =, n∈Z. We can factor out π/2 to give us the common form of the asymptote equation, x = (π/2)(2n+1), n∈Z. The n refers to the number of periods down the line that we are.
Our four asymptotes are (-3π/2), (-π/2), (π/2), and (3π/2).

Graphing the Tangent
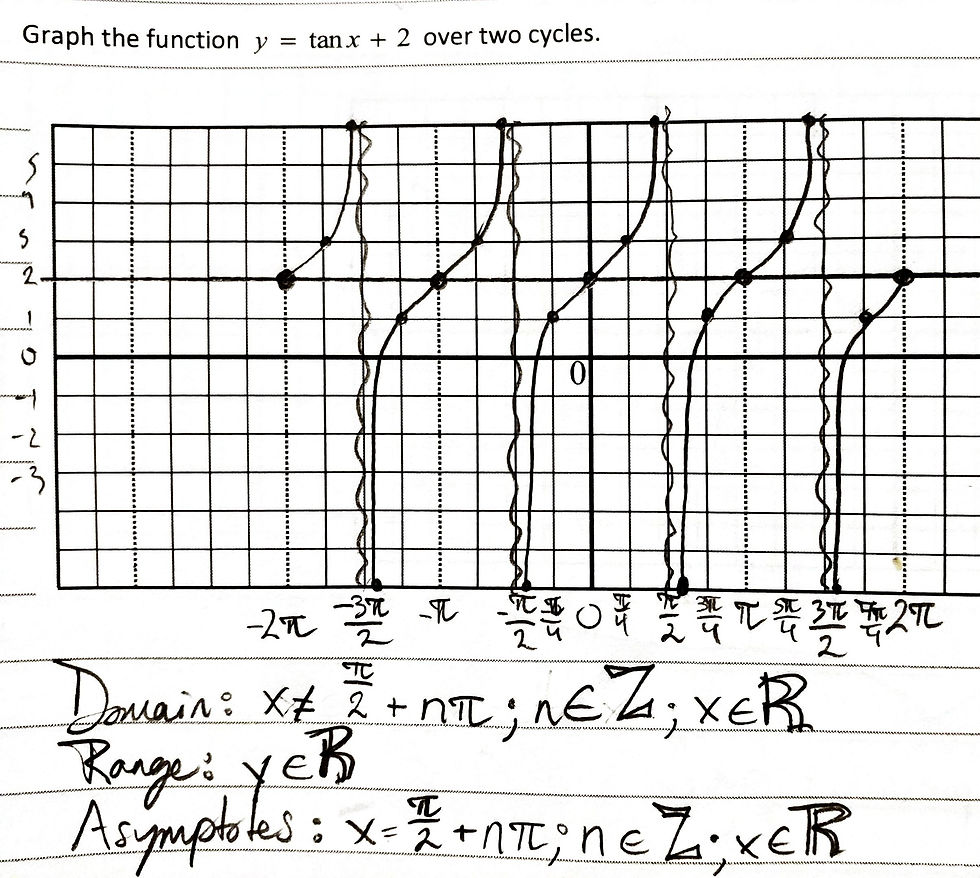
Before we can graph a tangent function, we must consider any transformations that might apply. You can see in the graph on the right that the function I was graphing had a vertical displacement of +2.
Much like the sine and cosine graphs, we can have changes in amplitude, phase shift, vertical displacement, and period. One important thing to note when calculating the period of a tan function vs a sine/cosine function: The default period of a sine function or cosine function is 2π, so we can determine the period by solving for b in the equation 2π/b. In a tangent function, the period is π; this means that to find the period of a tangent function, we must solve for b with the equation π/b.
Once we have found the period, we can easily determine the asymptotes: they occur at 1/2 of every period, so we just find half of the period, the substitute that value for π/2 in our equation for asymptotes and restrictions, π/2(2n+1). For example, in the function y = tan2x, we can use the equation π/b to determine that our period is π/2. Half of π/2 is π/4; substituting that into our asymptote equation, we know that the asymptotes will be at π/4(2n+1).
In some cases, we may need to do a bit more work to find the asymptotes of a function. An example would be a function with a phase shift. When working with functions which have phase shifts and period transformations, we can solve algebraically for x. For example, to find the asymptotes of the equation y = tan(2x-π/3), we would say that 2x-π/3 = (π/2)(2n+1). We would find the common factor of our denominators, multiply both sides by 6 to remove the fractions, get rid of the brackets through multiplication (distributive property), then we would group like terms, and finally we would divide both sides by x's coefficient, giving us x=(6πn+5π)/12 as our general equation for asymptotes.
That's it for this lesson; next time, we'll be learning about graphing the reciprocal trigonometric functions!


Comments